Data table diagrams
Best for reference data — anything that’s naturally rows and columns. There’s no special keyword: a standard GitHub-Flavored Markdown table renders as a table card.
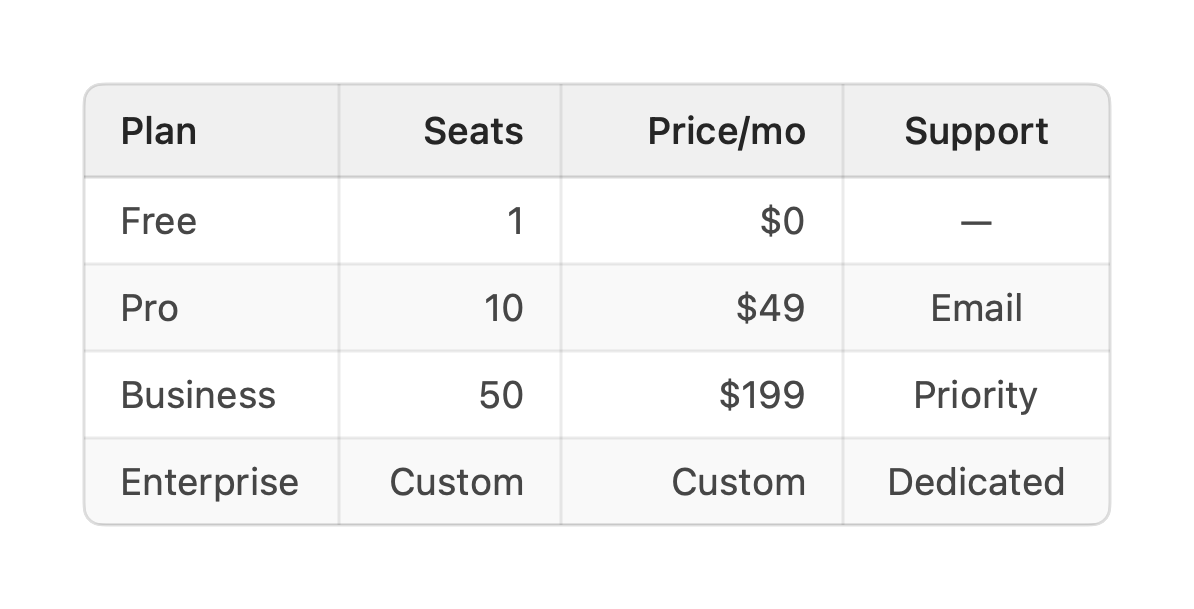
| Plan | Seats | Price/mo | Support || ---------- | -----: | -------: | :-------: || Free | 1 | $0 | — || Pro | 10 | $49 | Email || Business | 50 | $199 | Priority || Enterprise | Custom | Custom | Dedicated |A header row, a delimiter row, then the data rows — the usual Markdown table. Leading and
trailing pipes are optional, and \| escapes a literal pipe inside a cell.
- Alignment comes from the delimiter row:
---(default),:---(left),:---:(center),---:(right). Above, the numeric columns are right-aligned andSupportis centered. - Column type is inferred from the cells — numeric columns right-align and render in a tabular figure style automatically.
- Nothing is fatal: a short row is padded with empty cells and an over-long one is truncated to the header’s column count, so a table never fails to render.
Titling a table
Section titled “Titling a table”A table has no in-fence title line, so to give it a heading add a vizzy
fence immediately below it. The id-less title and desc
forms label the card as a whole — title is the heading, desc a subtitle beneath it:
| Month | Region | Revenue | Deals | Close % || ----- | ------ | ------: | ----: | ------: || Jan   | EMEA   |   5,000 |    42 |     31% || Feb   | EMEA   |   6,000 |    51 |     34% |
```vizzytitle Q2 revenue by regiondesc Monthly revenue, deals closed, and close rate — sortable and filterable.```
The fence binds to whatever block sits directly above it, so place it right after the table it describes — not at the bottom of a file that holds several diagrams.